Step 1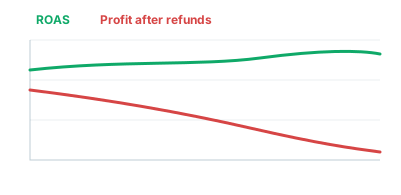
Offer
 Weekly review
Last monthNow
Your ROAS holds. Profit falls.
The front end converts. The money goes missing after the sale.

Data Driven shows scaling offer owners what a customer is actually worth, so they know exactly how much they can spend to acquire one and what to pay every affiliate, across every offer.
We use your email to set up the call and send you the curves we build on it, nothing else. See our privacy policy for the details.
Trusted by growth teams at 120+ companies
For founders, heads of growth and media buyers
Front-end ROAS looks fine until refunds, rebills and product costs land. By then the budget is spent, and every platform tells a different story.
For founders, heads of growth and media buyers
Front-end ROAS looks fine until refunds, rebills and product costs land. By then the budget is spent, and every platform tells a different story.
Offer
Weekly review
The front end converts. The money goes missing after the sale.
What each platform says
Summary
 Ad platform
 +14%
 Checkout-27%
 Affiliates-2%
The ad account, checkout and affiliate network each tell their own story.
Today, 12:09pm
Someone opens the spreadsheets. Answers come a week later.
 Ask anything...


It answers from the half of the picture it sees.
What the dashboard is missing:
 Your refunds
 Your margins
 Your cohorts
 Your back end
 Your break-even day
 Your history
The answer sounds confident. The numbers stop at the first order. You are late.
How Data Driven works
30 minutes, no deck.
Connect
Every checkout, subscription, call center and ad account in a single customer record, with refunds, costs and chargebacks.
Measure
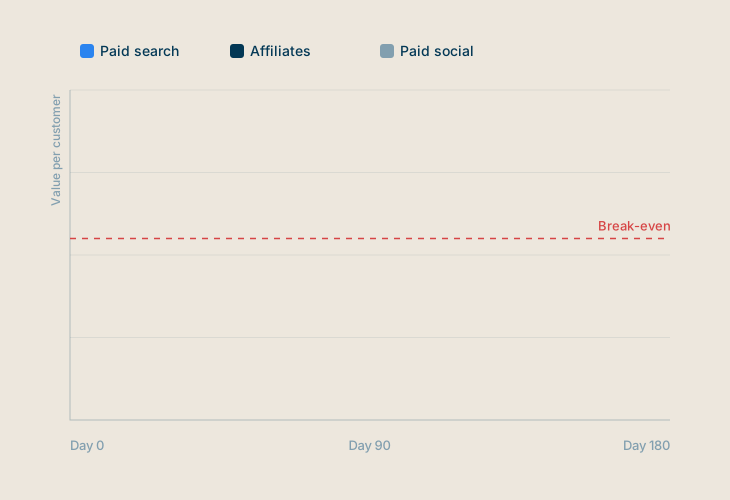
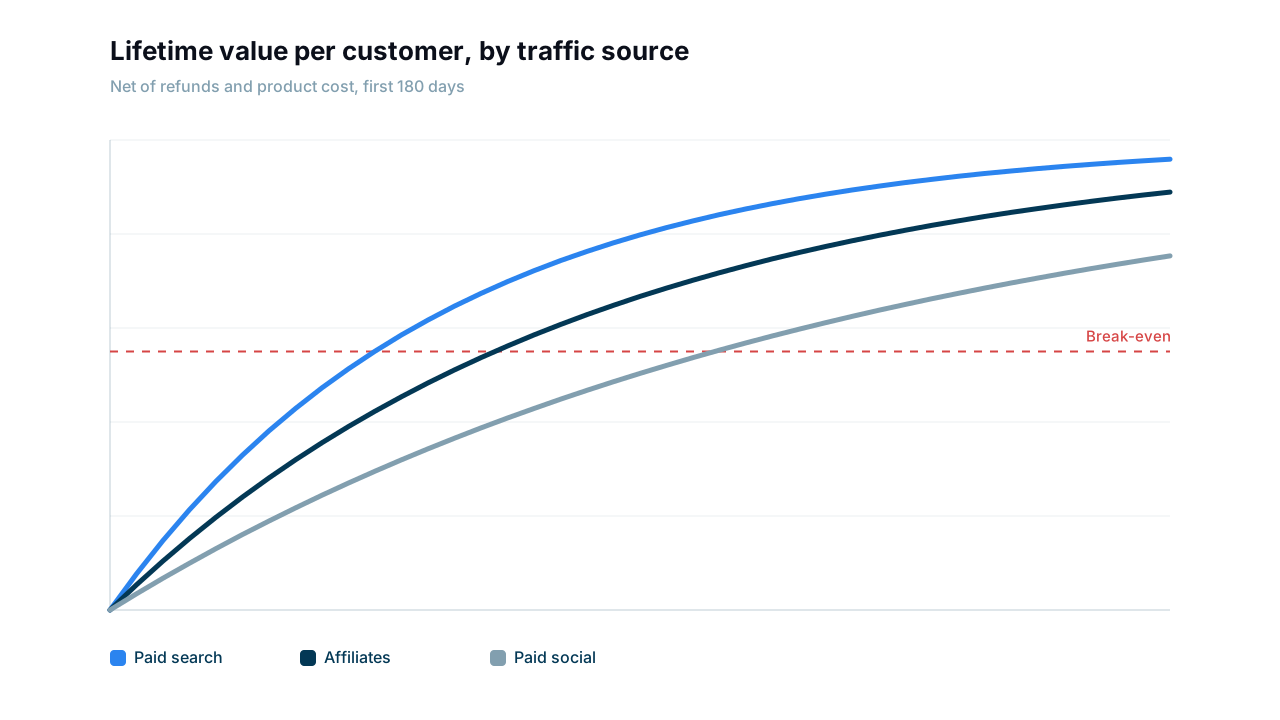
Lifetime value by day, per offer and traffic source, net of refunds, product costs and chargebacks.
Decide
Break-even day and spend limits for every offer, read off the curves.
Act
Tiered spend plans and offer tests, agreed in a weekly review.
$3.1B+
Revenue analyzed
Revenue we have analyzed for direct-response brands.
120+
Companies' data captured
Companies whose customer data we captured and modeled.
Across 7+ years.
1,300+
Strategy calls
Strategy calls with CEOs, CMOs and founders.
LTV Numbers is the platform under every engagement. It turns your order history into curves you can act on.
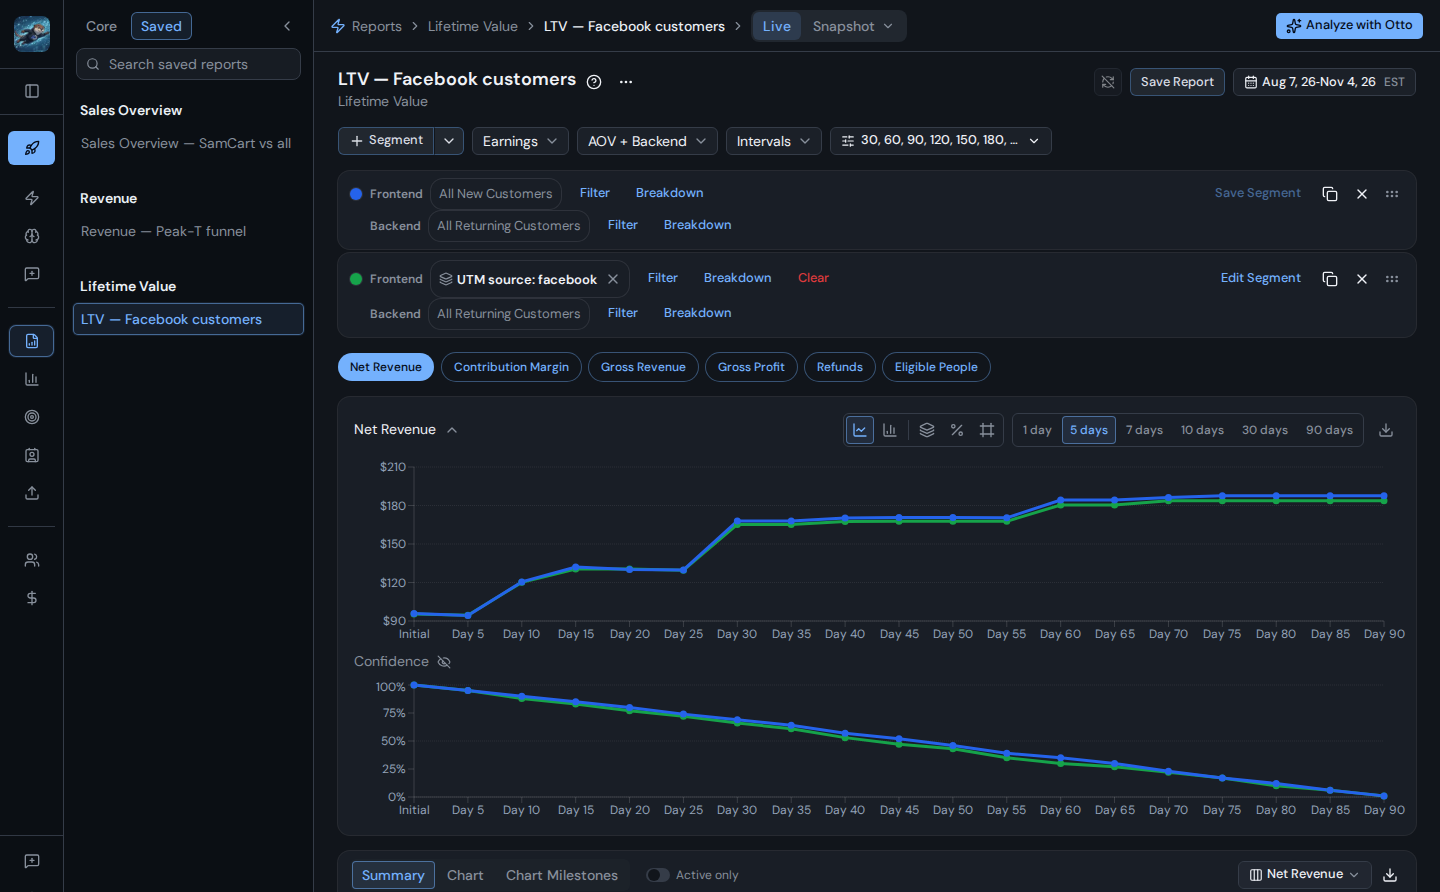
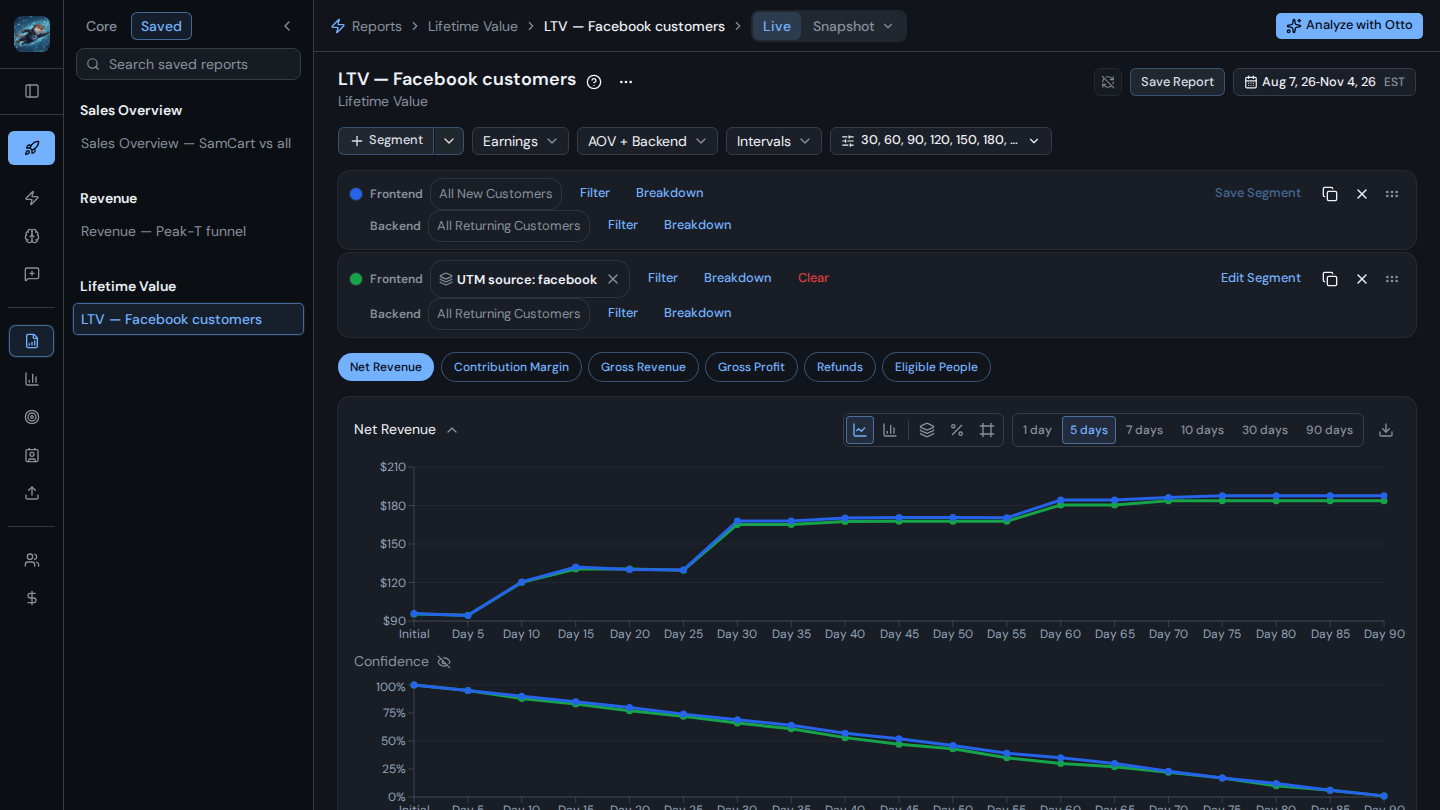
Value per customer by day, from the first order on, net of refunds and product cost. Lay two curves side by side and the better offer is obvious at a glance, no spreadsheet required.
Learn more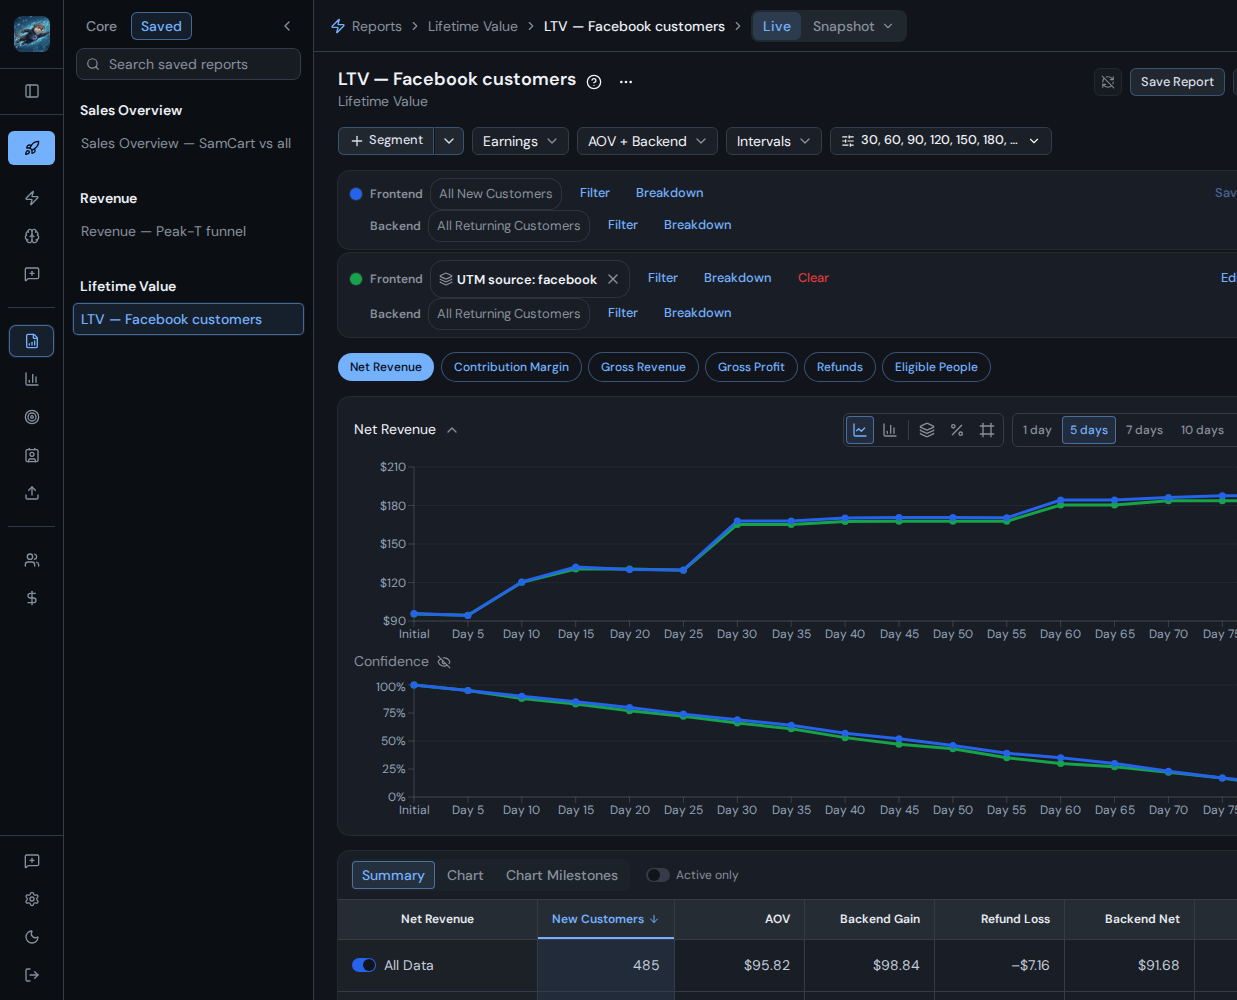
Refunds and chargebacks by offer, cohort and customer, in dollars, so the front ends that sell buyers who stay stand out.
Learn more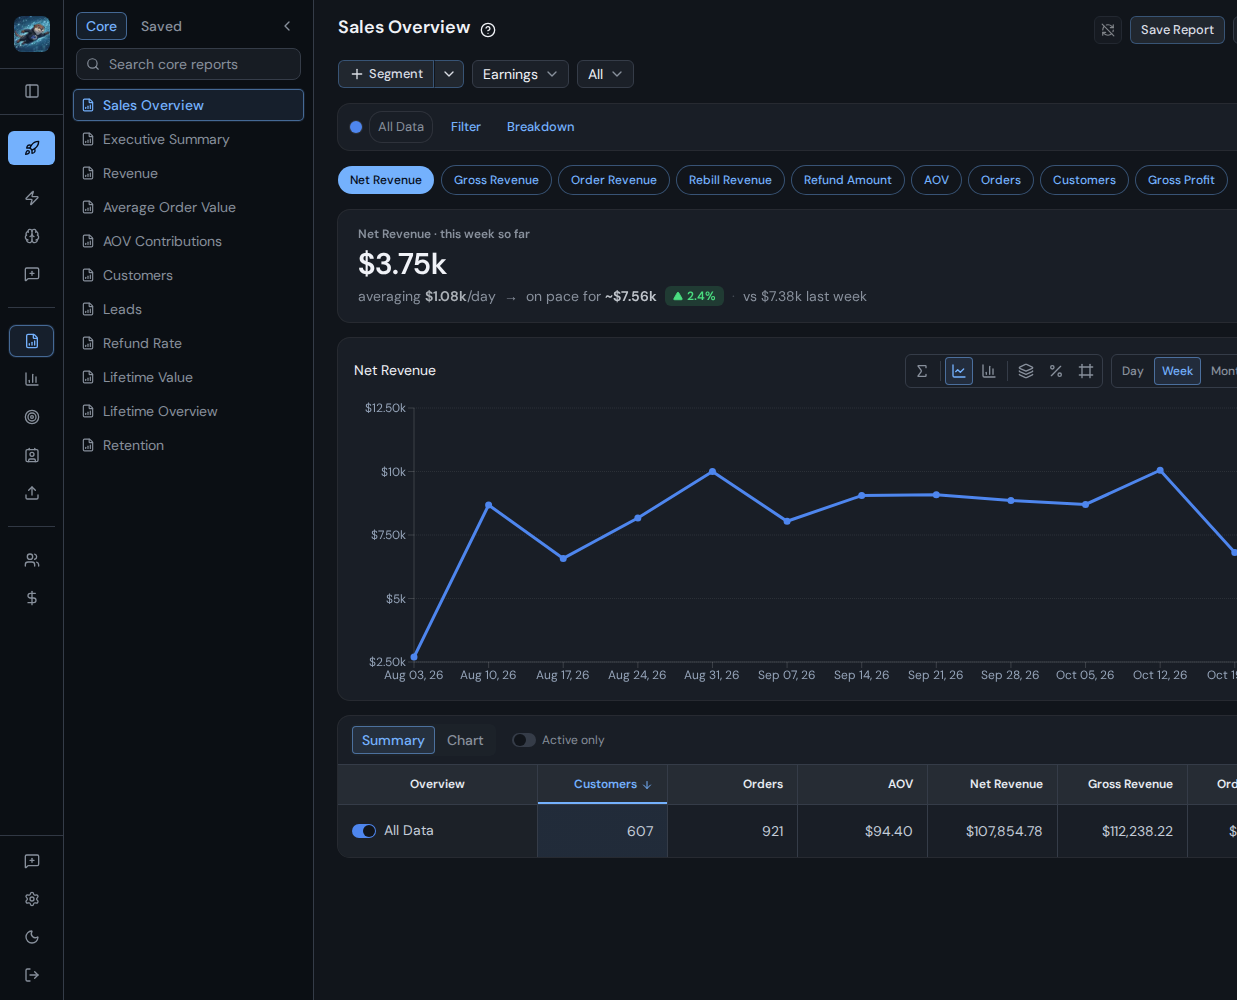
Each month's new customers followed from the first order, so a change in offer or traffic shows up in the money it made.
Learn moreAny curve cut by offer, channel, affiliate or campaign, so a weak source cannot hide inside a good average.
Learn moreRefunds and chargebacks by offer, cohort and customer, in dollars, so the front ends that sell buyers who stay stand out.
Learn moreEach month's new customers followed from the first order, so a change in offer or traffic shows up in the money it made.
Learn moreAny curve cut by offer, channel, affiliate or campaign, so a weak source cannot hide inside a good average.
Learn moreRefunds and chargebacks by offer, cohort and customer, in dollars, so the front ends that sell buyers who stay stand out.
Learn moreEach month's new customers followed from the first order, so a change in offer or traffic shows up in the money it made.
Learn moreAny curve cut by offer, channel, affiliate or campaign, so a weak source cannot hide inside a good average.
Learn moreHear how a food club settled which customers were worth paying for.
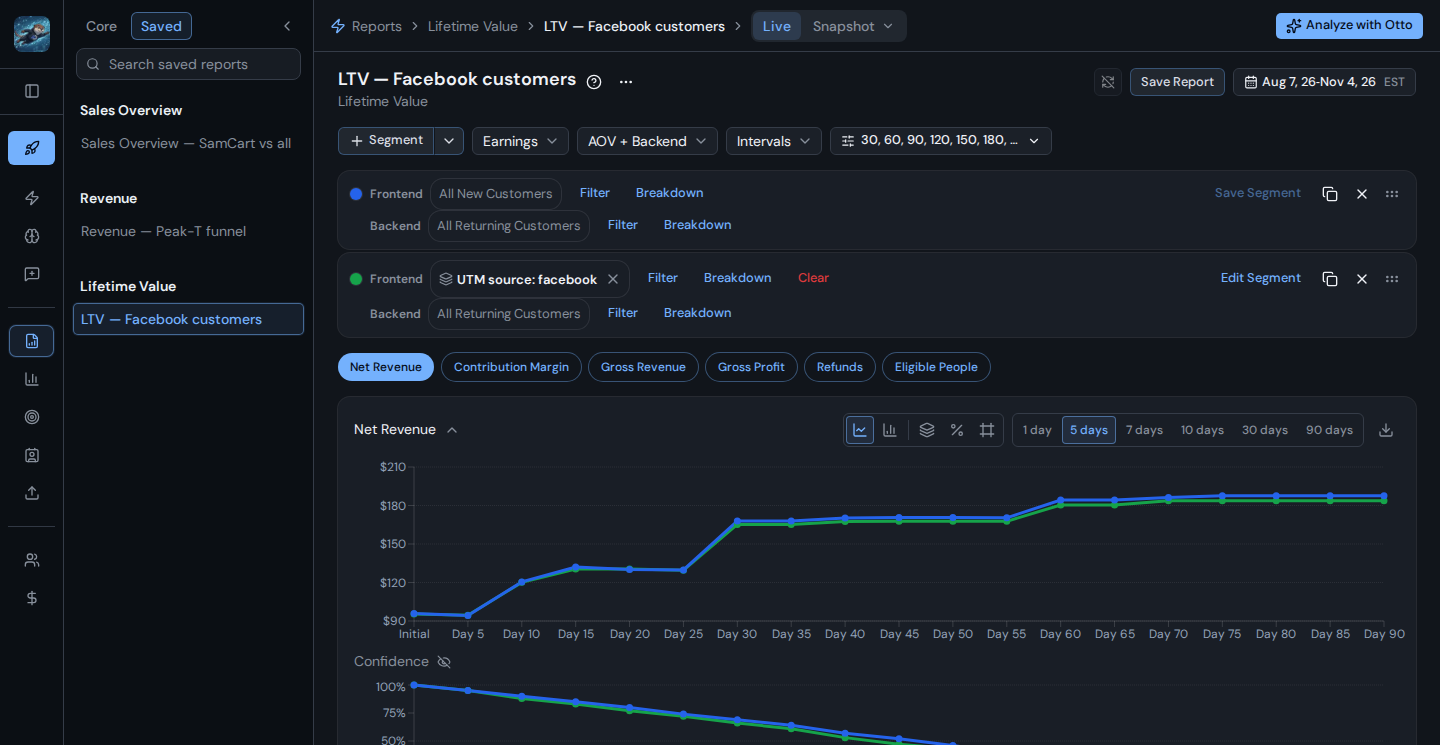
Real-time clarity into customer lifetime value, paired with analysts who help you act on it. When you can see what is happening to every customer, the right call is obvious.
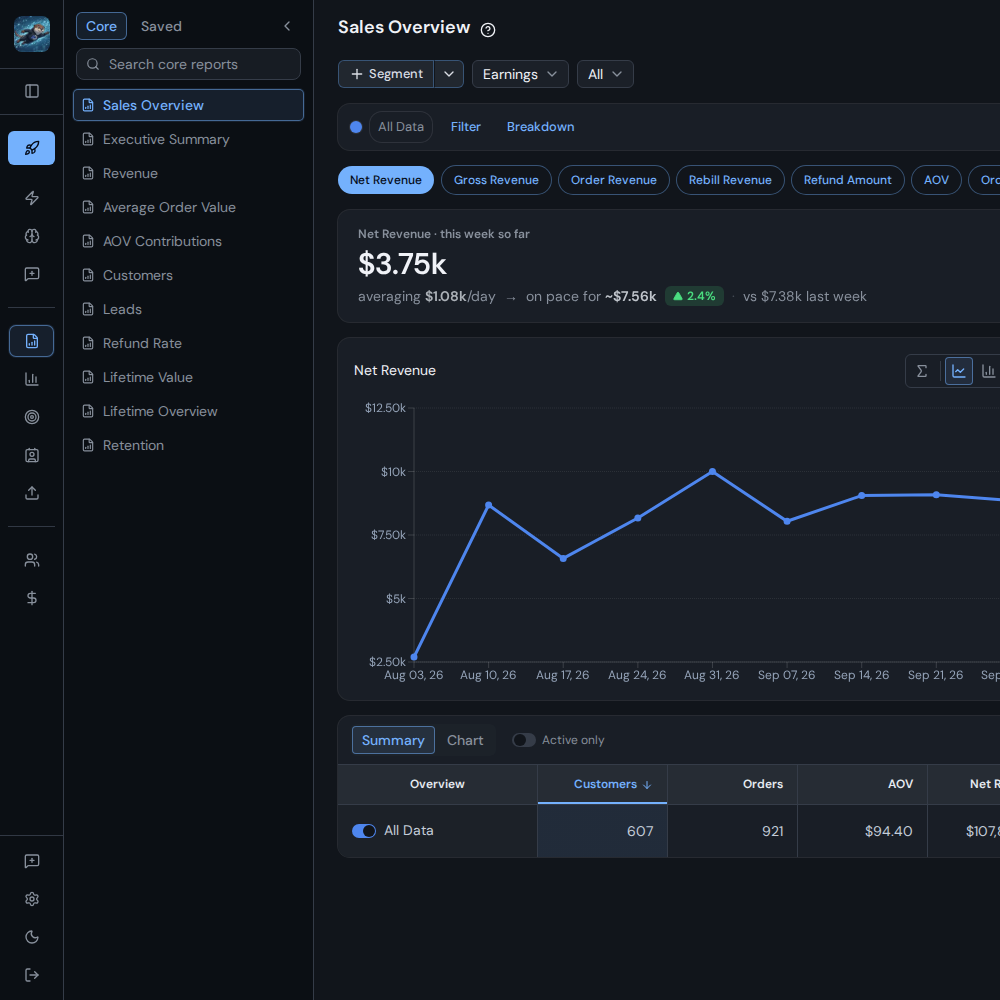
True customer value
Contribution margin by day, per offer and traffic source, before you scale spend against it or cut it.
Every sale, attributed
Backend and rebill revenue mapped to the original buyer, even through affiliate and call-center funnels.
Honest analysts
Your unit economics against the portfolio: where a funnel is fragile and what it costs.
Safe spend limits
Red, yellow and green cost-per-customer limits per offer, so every partner buys to one line.
Most teams run spend by hand from last week's ROAS and a spreadsheet nobody trusts. An engagement puts the real curves in front of the people deciding.
Orders, refunds, rebills, subscriptions, call centers and ad spend, matched to the platforms before anyone reads a chart.
The first analysis shows where the money goes after the first order: refunds, repeat purchases, or both. That sets the plan.
Spend limits, offer tests and affiliate targets, read off the same numbers each week with the evidence on screen.
Reports built around your questions, in your platform and your Slack, so daily decisions never wait on us.

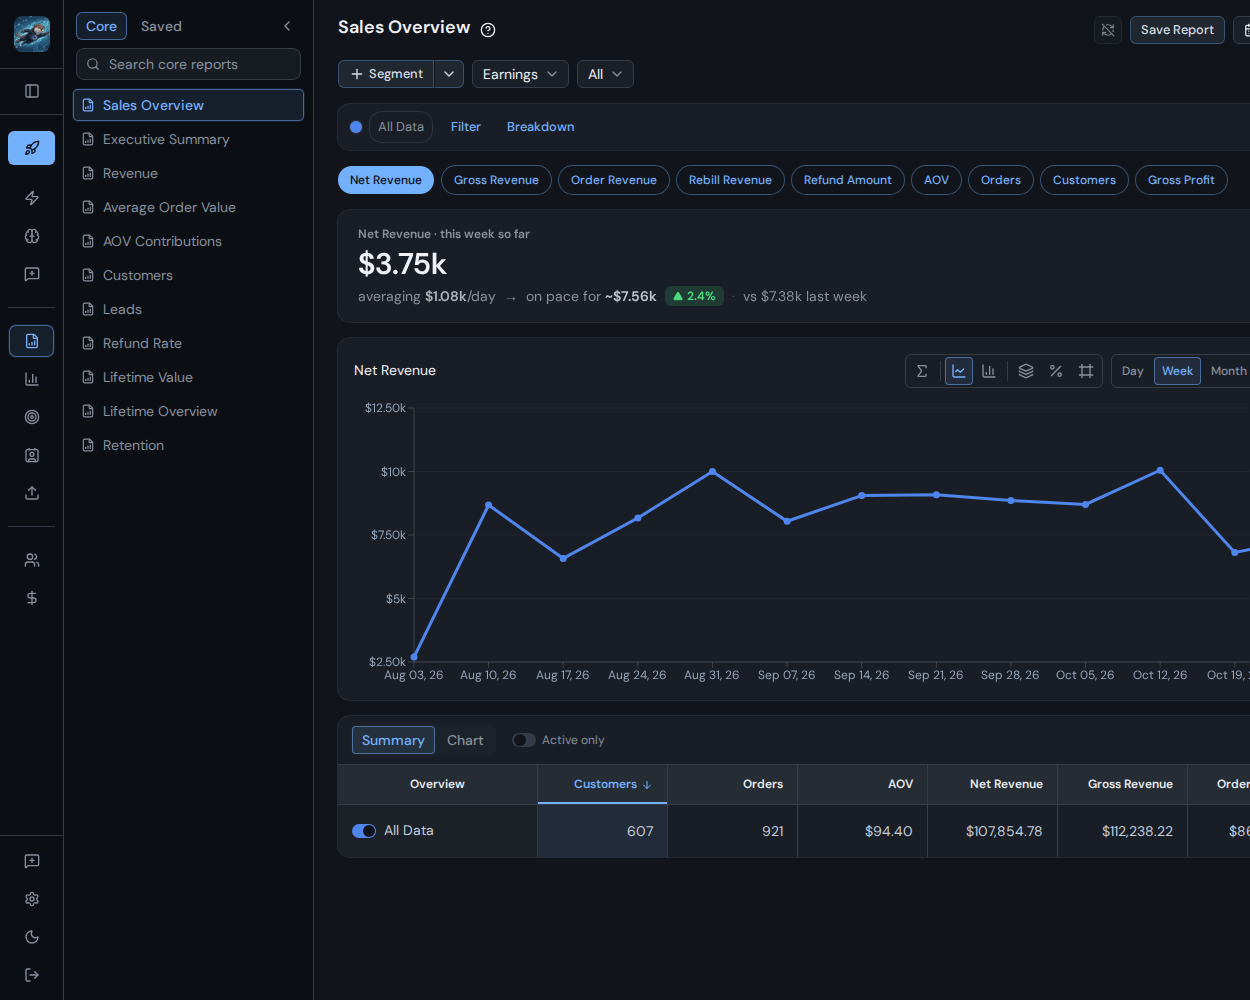
“Their tool has given us much stronger control and visibility over the metrics that matter most to our operation. … We also gained much better visibility into refunds and chargebacks, which helped us improve monitoring, reduce losses, and strengthen our internal control processes.”
We use your email to set up the call and send the curves we build on it. See our privacy policy for how we handle data.
Thirty minutes on your numbers: where your customers come from, what they cost, and what they are worth over time. You leave with a clear next step.
No prep needed. Bring rough revenue and ad spend numbers if you have them. The Zoom link comes with your confirmation.